
Data & analytics
Brightway Sales Performance Dashboard
An Excel dashboard tracking six months of retail sales across stores, product categories and online channels.
- Status
- Prototype Portfolio case study
- Access
- Demo currently unavailable
- Type
- Concept
- Role
- Dashboard design and analysis by Daramola Joseph Omoyele.
- Built with
- Microsoft Excel
- Link checked
- Portfolio case study (10 October 2026)
The problem
Monthly sales files need consistent categories and revenue definitions before stores and channels can be compared.
Who it is for
Retail managers and analysts reviewing sales across channels.
What was built
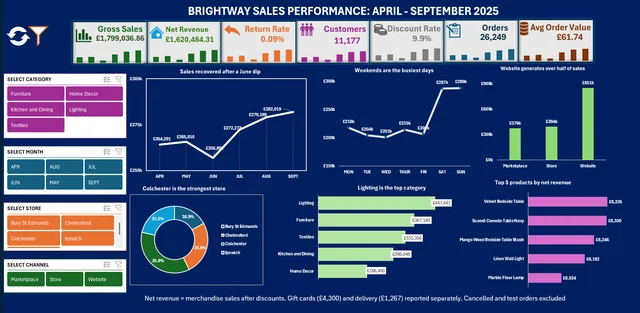
Used Power Query to prepare monthly files and built a dashboard with connected slicers and pivot charts.
Key features
- Month, store, sales channel and category slicers
- Gross sales, net revenue, orders and average order value
- Return and discount rates
- Monthly trends and comparisons by product, store and channel
Results so far
The fictional dataset shows £1.62m in net revenue from April to September 2025, with website sales contributing just over half.
Limitations and context
- The portfolio presents a dashboard screenshot.