UK AI Economic Measurement Lab
An independent research prototype exploring how artificial intelligence could be identified and measured within UK National Accounts frameworks.
Open to try
Independent research

Data analysis, dashboards and research
Turn data you already hold into clear answers. I clean and check it, analyse it with the right method, and present the results in a report or dashboard your team can use without a statistics degree.
Who it is for
What I can help with
Find and fix duplicates, gaps, unit errors and inconsistent categories, with a record of every change.
Descriptive and statistical analysis in SQL, R, Python or Excel: trends, comparisons, drivers and forecasts, with assumptions stated.
Power BI, Tableau or web dashboards built around the decisions your team makes each week.
Questionnaire data cleaned, weighted where appropriate, analysed and written up in plain English.
Economic research and evaluation of outcomes and impact, with methods, assumptions and limitations stated.
Recurring reports produced automatically from your data, so the numbers are consistent every month.
Examples
Real projects with their status shown: live, pilot or prototype.
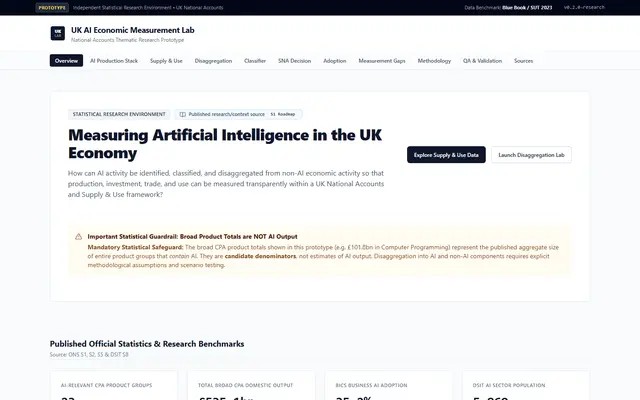
An independent research prototype exploring how artificial intelligence could be identified and measured within UK National Accounts frameworks.
Open to try
Independent research
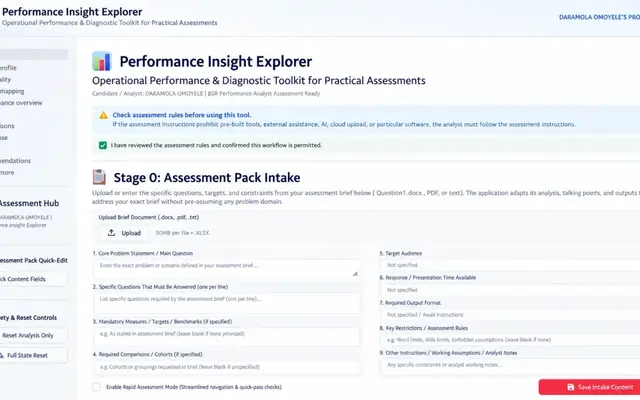
Upload an unfamiliar operational dataset and work through profiling, data-quality checks, KPI set-up, trends, root-cause exploration and exportable reporting.
Open to try
Own product
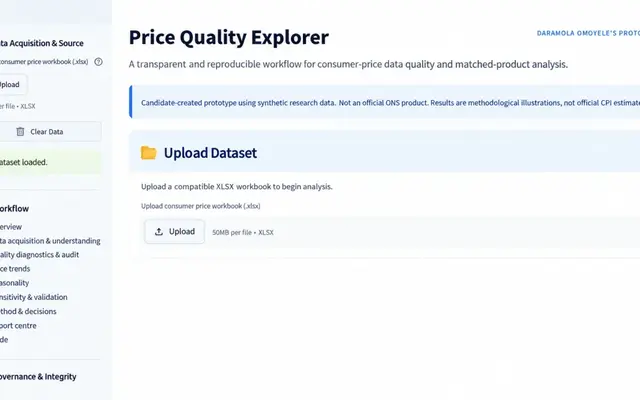
Turns a messy price collection into a matched-model price index, a written method note, and a report and slide deck you can send on.
Account sign-in required
Own product
A reproducible workflow for consumer-price data quality and matched-product index analysis, built on synthetic research data.
Demo currently unavailable
Independent research
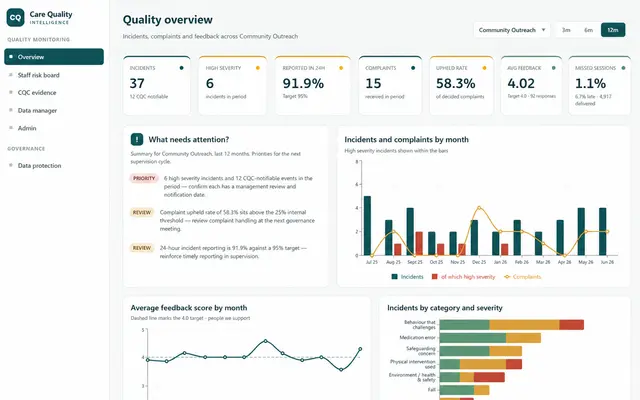
A quality-monitoring platform for adult social care that turns incidents, complaints and feedback into fair staff-level insight, supervision packs and inspection evidence.
Demo sign-in provided
Own product
Process
Clarify the problem, users and desired outcomes.
Define the requirements, data needs and project scope.
Develop the solution and check it against agreed requirements.
Prepare handover and agree any ongoing support.
Questions
Spreadsheets (Excel, CSV), database exports and survey-platform exports are typical. If you are unsure, describe what you have and I will tell you what is feasible.
How data is shared and protected is agreed before anything is sent. Wherever possible I work with the minimum data needed or an anonymised extract.
Not necessarily. Dashboards can be built in a tool your organisation already uses, in Excel, or as a web dashboard; licensing is your choice.
Every project is quoted in writing after a short discovery conversation. No fixed prices are published.
Tell me what you need and where you are starting from. I will reply with questions or next steps. No obligation.