
Data & analytics
Price Quality Explorer
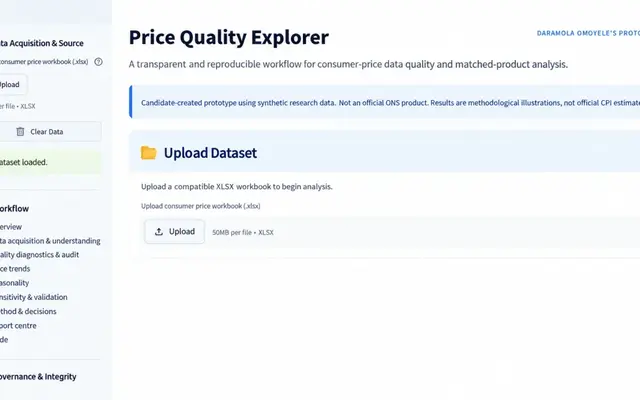
A reproducible workflow for consumer-price data quality and matched-product index analysis, built on synthetic research data.
- Status
- Prototype Live demo currently unavailable
- Access
- Demo currently unavailable
- Type
- Independent research
- Role
- Sole developer and analyst.
- Built with
- Python
- Streamlit
- pandas
- Plotly
- ReportLab
- openpyxl
- python-pptx
- Link checked
- Demo URL returns "no access / does not exist" (10 October 2026)
The problem
Price microdata contains zero quotes, scale errors and seasonal items. Without a transparent audit trail, index results are hard to check.
Who it is for
Analysts working with consumer price microdata.
What was built
A Streamlit application that validates the data, flags anomalies without overwriting raw values, builds matched-product Jevons indices, profiles seasonality and runs sensitivity checks, with audience-specific PDF briefings, a slide deck and calculation workbooks.
Key features
- Schema and referential-integrity validation
- Anomaly flagging that preserves original values
- Matched-product index construction and seasonality profiles
- Sensitivity checks against an alternative method
- Audience-tailored PDF, PowerPoint and Excel outputs
Results so far
Methodology illustration on synthetic data. Results are not official estimates.
Limitations and context
- Uses synthetic research data; not an official ONS product.
- The hosted demo is not currently accessible. Source is private.