
Data & analytics
Business Performance Dashboard
An executive dashboard for comparing revenue, profit, orders and performance against target.
- Status
- Prototype Portfolio case study
- Access
- Demo currently unavailable
- Type
- Concept
- Role
- Dashboard design and analysis by Daramola Joseph Omoyele.
- Built with
- Microsoft Excel
- Link checked
- Portfolio case study (10 October 2026)
The problem
Executives need an overview of sales and profitability with clear routes into more detailed analysis.
Who it is for
Managers reviewing sales and profitability across regions.
What was built
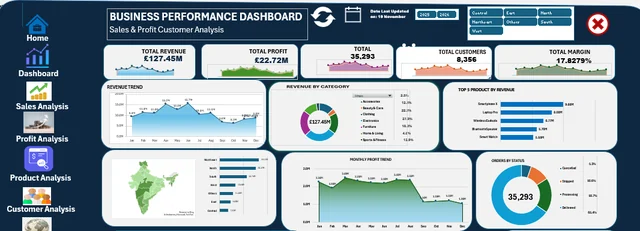
Designed an executive overview with summary cards, monthly trends, regional comparisons and navigation to supporting analysis pages.
Key features
- Revenue, profit, order, customer and margin KPIs
- Year and regional filters
- Product and category comparisons
- Order status breakdown and revenue versus target
Results so far
The dashboard brings performance trends, regional differences and target tracking into one view.
Limitations and context
- The portfolio presents a dashboard screenshot.