
Data & analytics
Donation Trends Dashboard
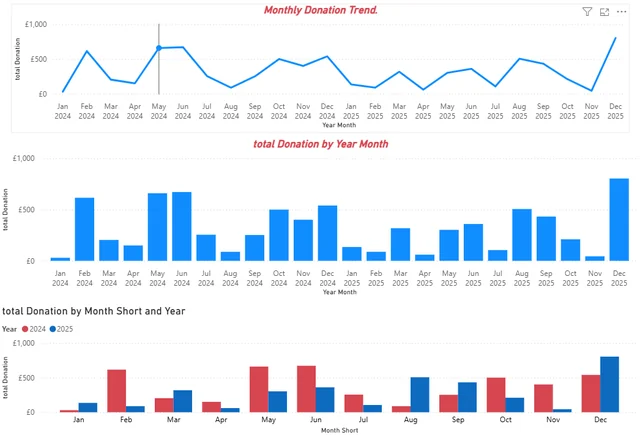
A report that tracks monthly donations and compares the same months across two years.
- Status
- Prototype Portfolio case study
- Access
- Demo currently unavailable
- Type
- Concept
- Role
- Dashboard design and analysis by Daramola Joseph Omoyele.
- Built with
- Power BI
- Link checked
- Portfolio case study (10 October 2026)
The problem
Annual totals can hide seasonal peaks and changes in the timing of donations.
Who it is for
Fundraising teams and finance staff reviewing monthly income.
What was built
Built monthly trend charts and a side-by-side comparison of 2024 and 2025.
Key features
- Two-year monthly donation trend
- Monthly donation totals
- Same-month comparison across years
Results so far
The comparison makes it easier to spot the months that contributed most to changes in donation income.
Limitations and context
- The portfolio presents a dashboard screenshot.