
Data & analytics
Pizza Sales Dashboard
A Power BI report comparing order trends and ranking products by revenue, quantity and order frequency.
- Status
- Prototype Portfolio case study
- Access
- Demo currently unavailable
- Type
- Concept
- Role
- Dashboard design and analysis by Daramola Joseph Omoyele.
- Built with
- Power BI
- Link checked
- Portfolio case study (10 October 2026)
The problem
The products that sell the most units can differ from the ones that bring in the most revenue.
Who it is for
Restaurant operators and analysts reviewing sales and menu performance.
What was built
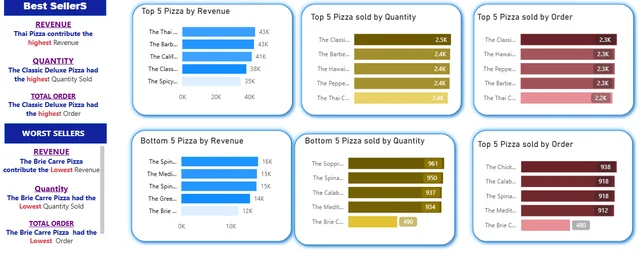
Built a sales overview with date and category filters and a dedicated page for best and worst sellers.
Key features
- Daily and monthly order patterns
- Revenue by pizza size and category
- Top and bottom products by revenue, quantity and orders
Results so far
The report lets users compare product rankings across three measures and identify which menu items merit a closer look.
Limitations and context
- The portfolio presents a dashboard screenshot.