
Data & analytics
Regional Mail Delivery Performance
A Power BI case study on regional delivery performance and the allocation of temporary delivery support.
- Status
- Prototype Portfolio case study
- Access
- Demo currently unavailable
- Type
- Concept
- Role
- Dashboard design and analysis by Daramola Joseph Omoyele.
- Built with
- Power BI
- Link checked
- Portfolio case study (10 October 2026)
Methodology and data quality
The problem
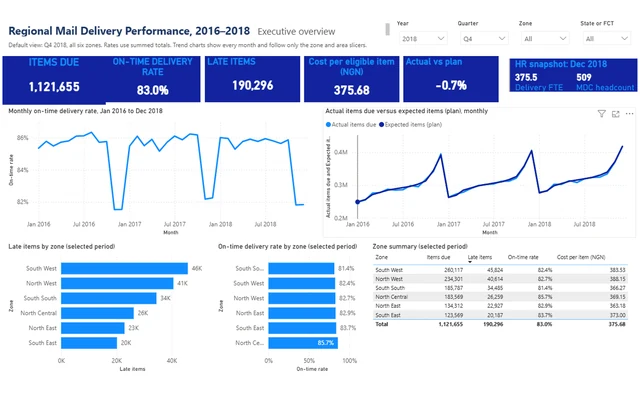
A region can have many late deliveries because it handles a large volume of mail. Teams need to consider both the volume and the rate of late deliveries when assigning support.
Who it is for
Operations managers and performance analysts responsible for service delivery.
What was built
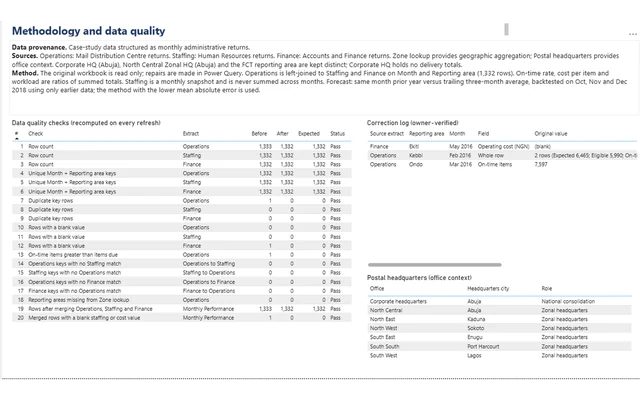
Built an executive overview, a staffing support decision page and a methodology and data quality page. Used Power Query to join operations, staffing and finance records by month and reporting area, and checked for duplicate keys, missing values and unmatched records on refresh.
Key features
- Delivery volume, on-time rate and cost per eligible item
- Monthly actual versus planned volumes
- Zone and state comparisons
- Staffing context for the support decision
- Refresh-time data quality checks and a documented correction log
Results so far
The report gives decision-makers a way to compare workload, delivery reliability and staffing context before allocating support.
Limitations and context
- This case study describes the reporting method and the decision it was designed to support.